Data Storytelling Animation Case Study for Tourism Burnaby
What visitors bring to Burnaby.
A data storytelling animation for Tourism Burnaby. Three kinds of visitors reveal the full economic impact tourism has on the city.
Client
Tourism Burnaby
Style
2D Animation
Runtime
2:55
catch the paper plane
01
The Brief
Tourism Burnaby wanted to show the value visitors bring. That meant three kinds of economic impact, direct, indirect and induced, each with its own numbers. Figures on their own would not keep viewers for three minutes.
02
Our Animation Approach
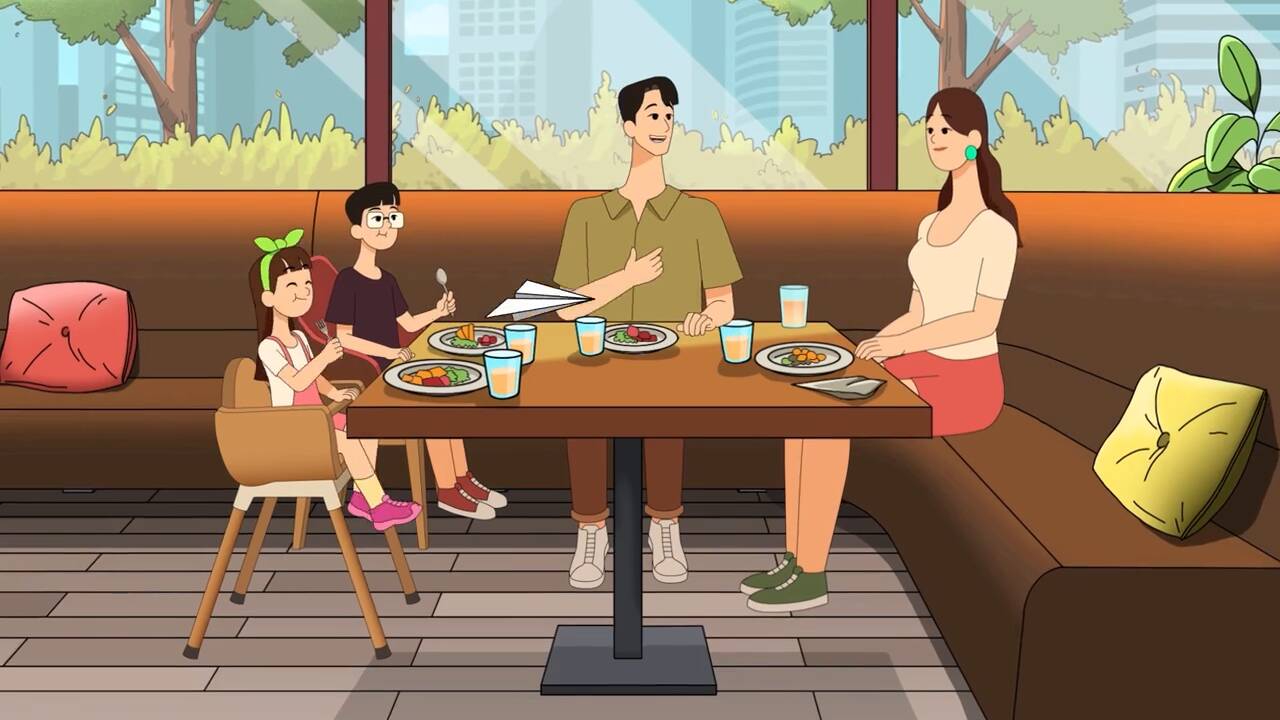
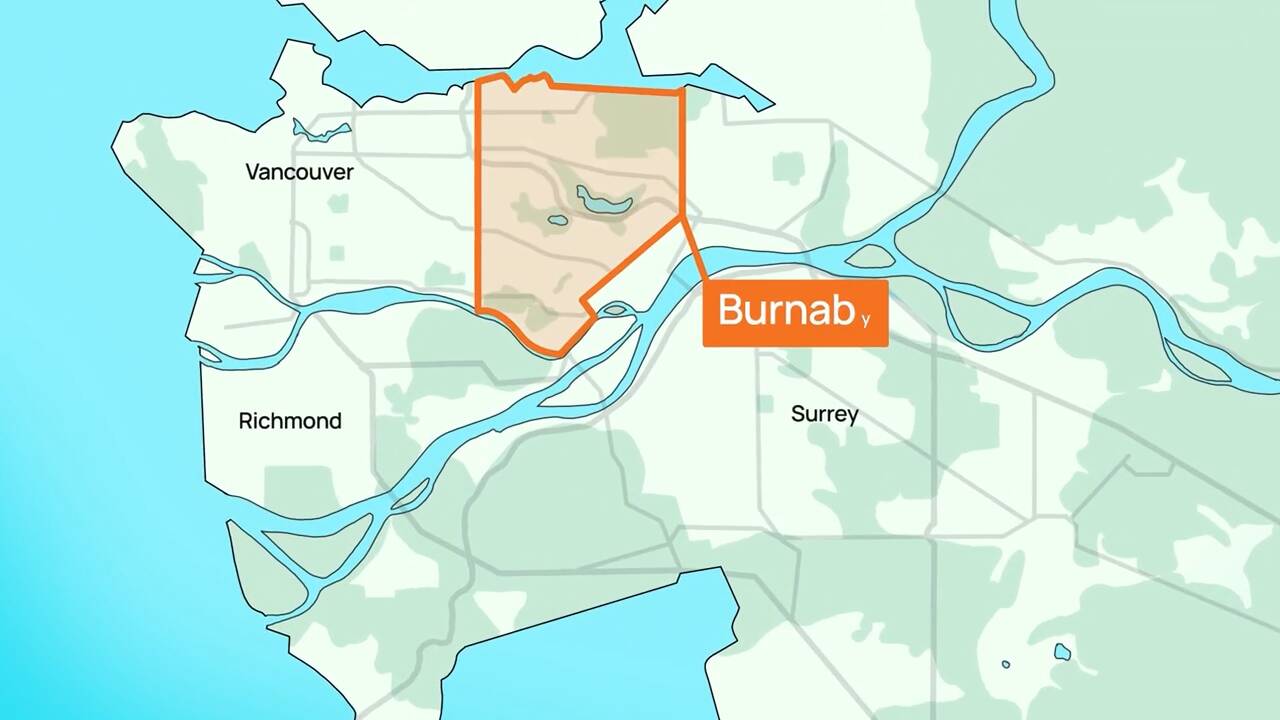
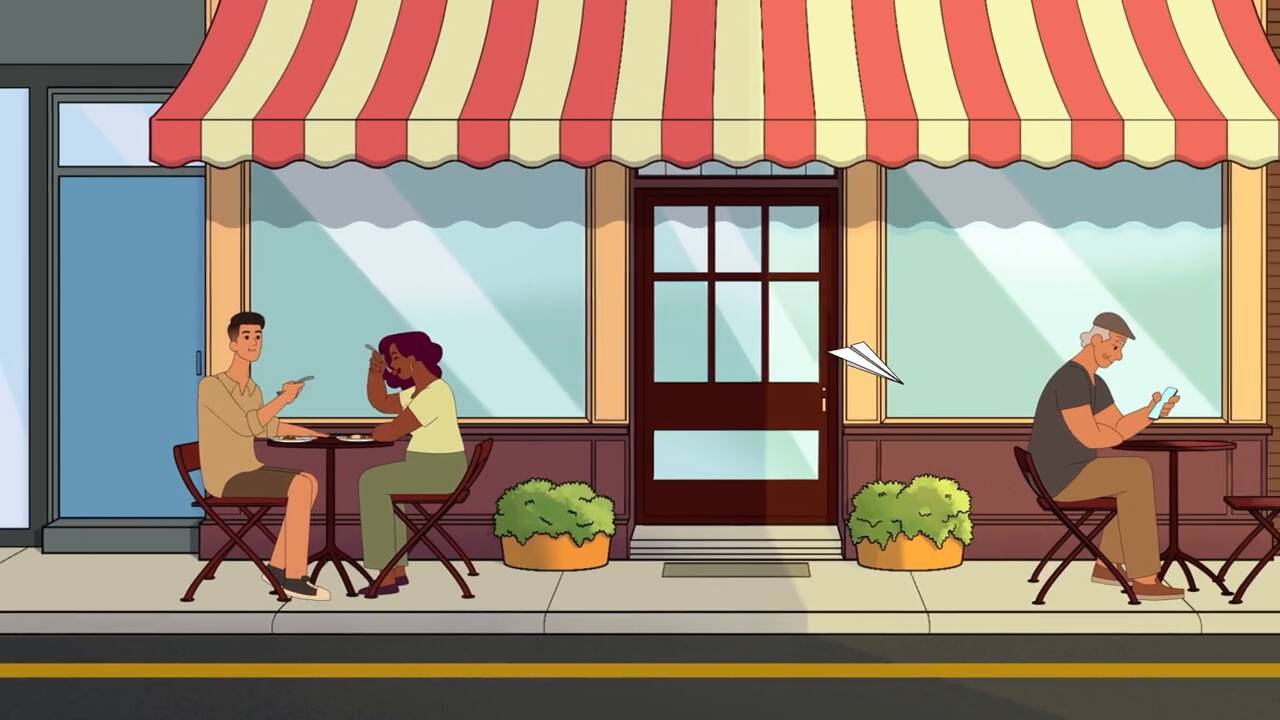
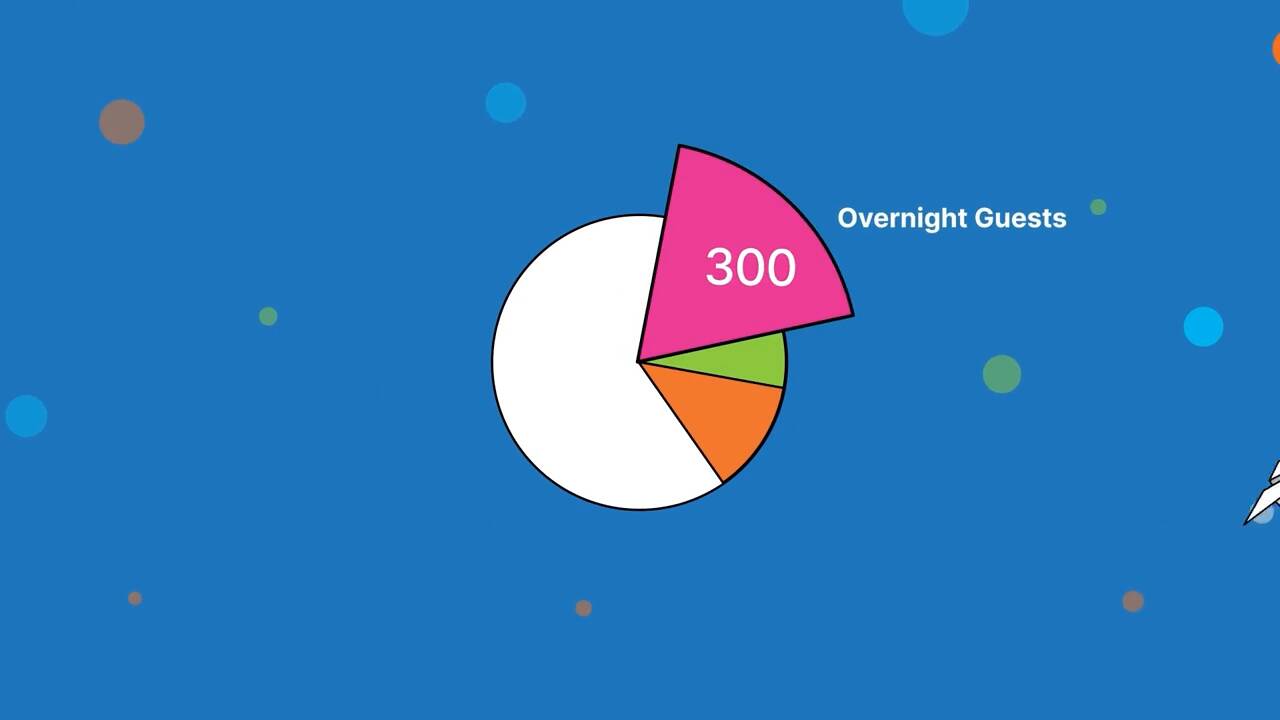
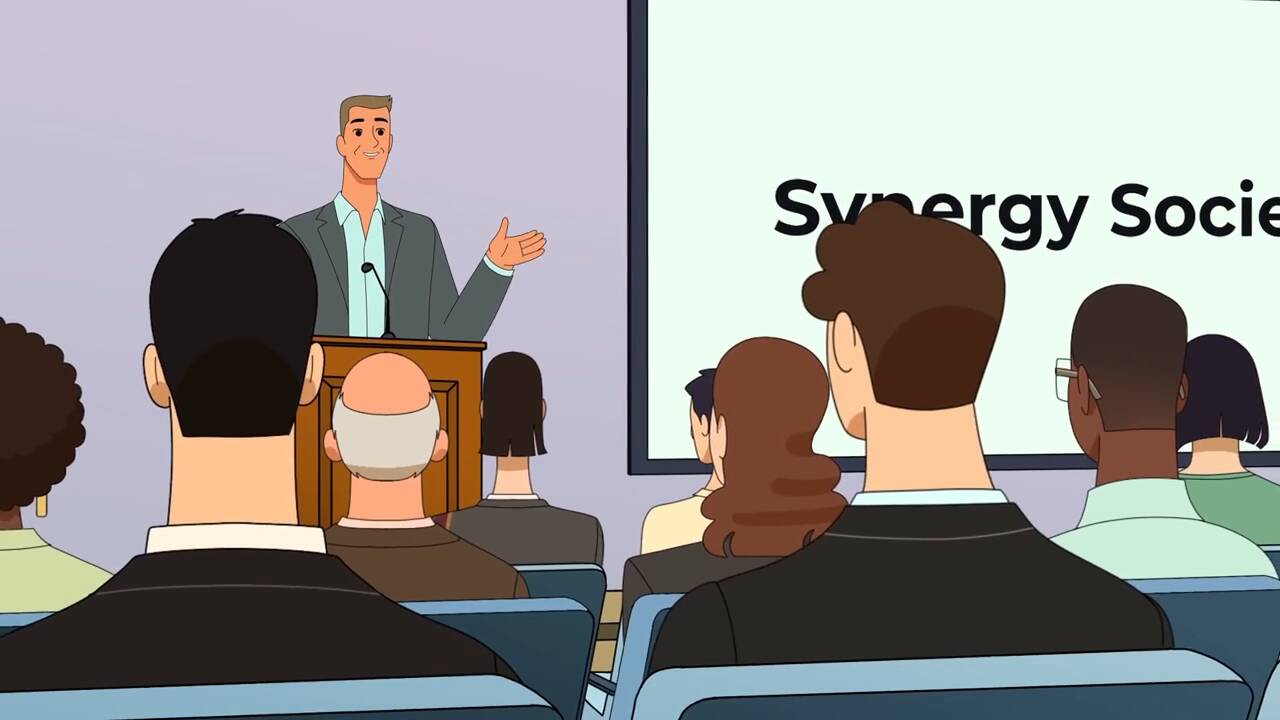
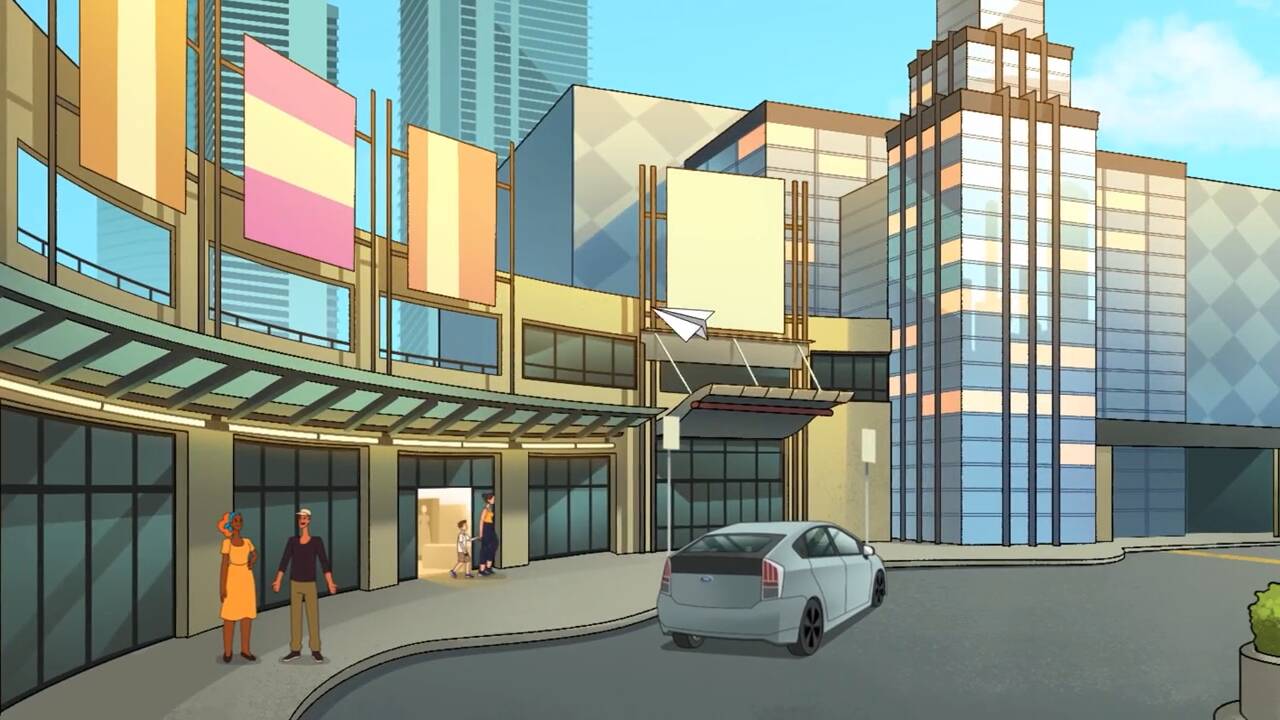
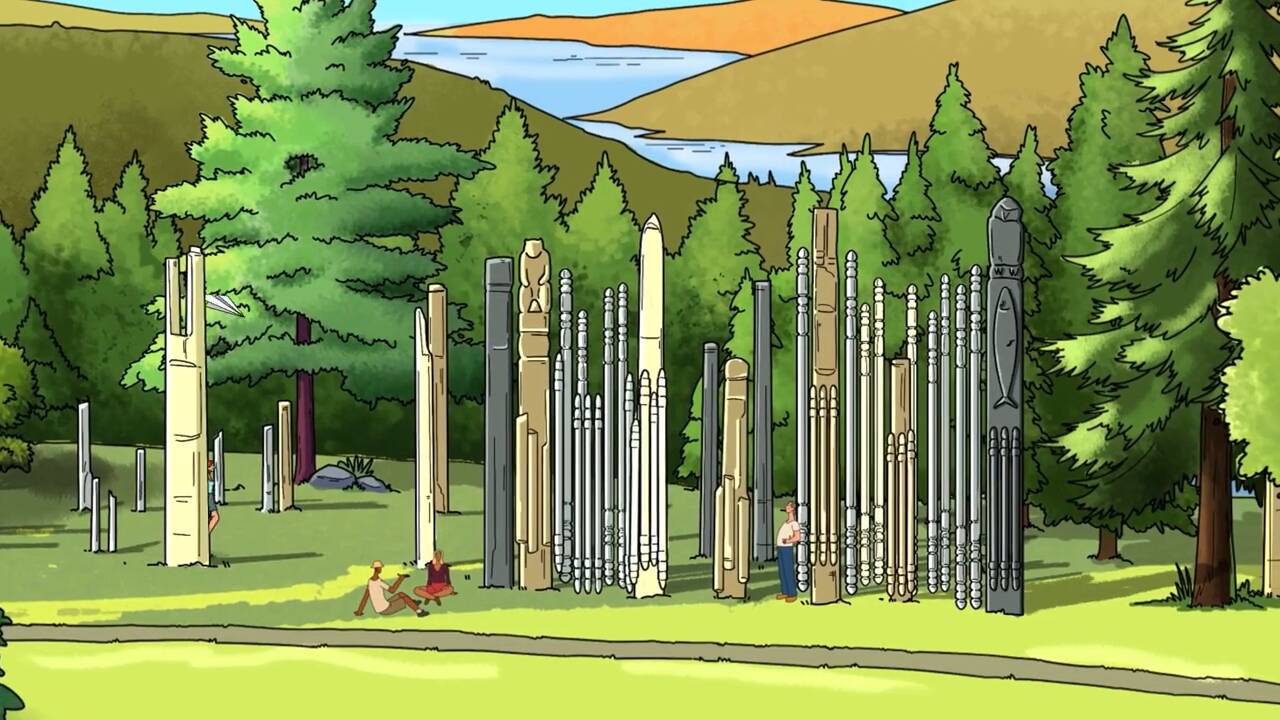
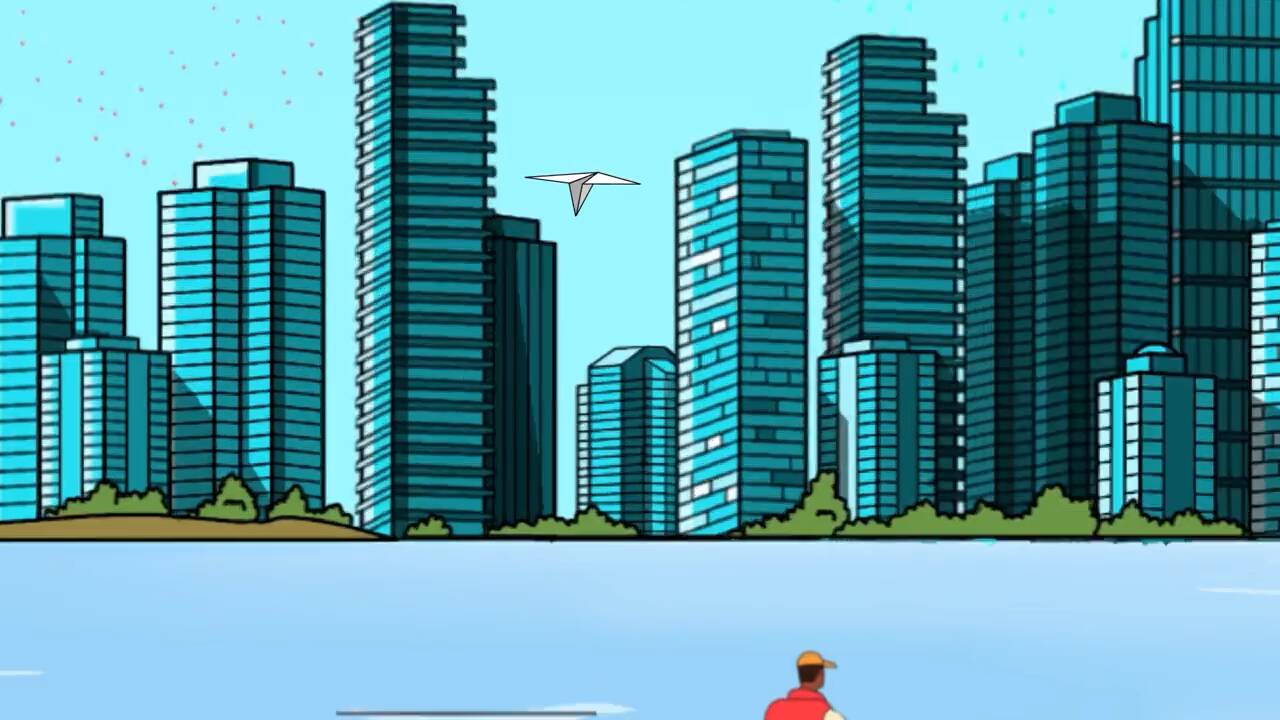
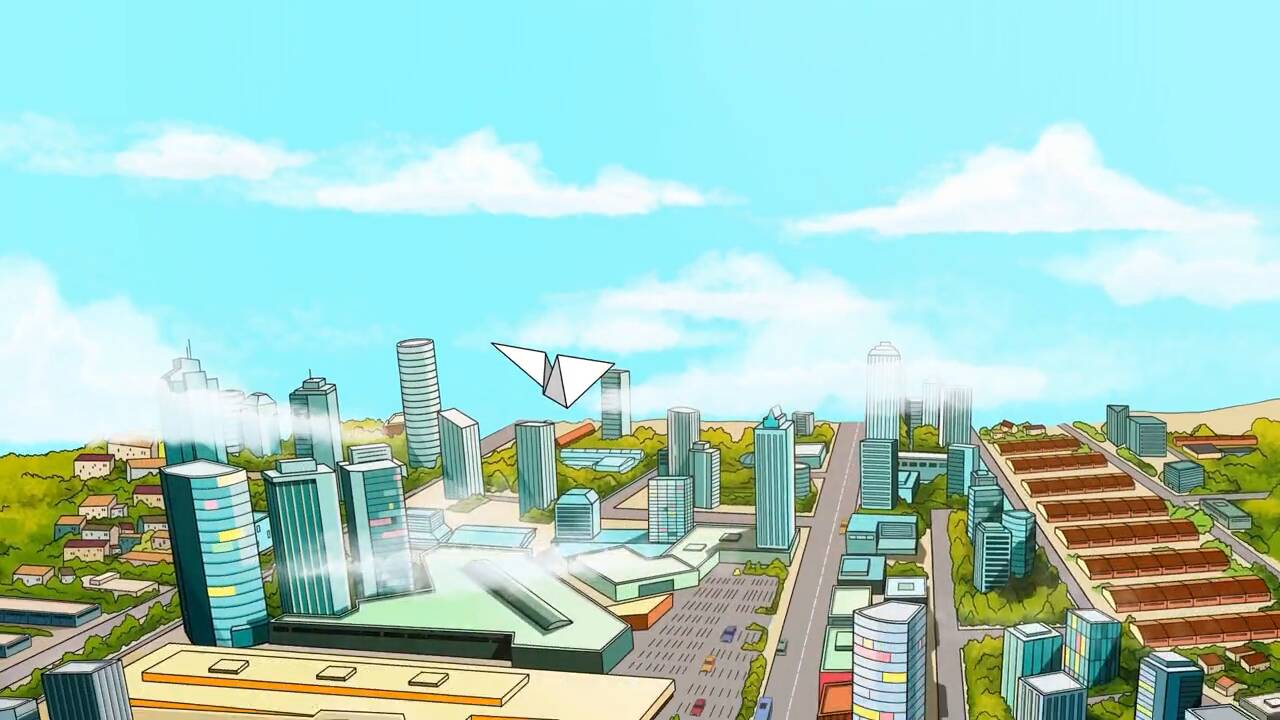
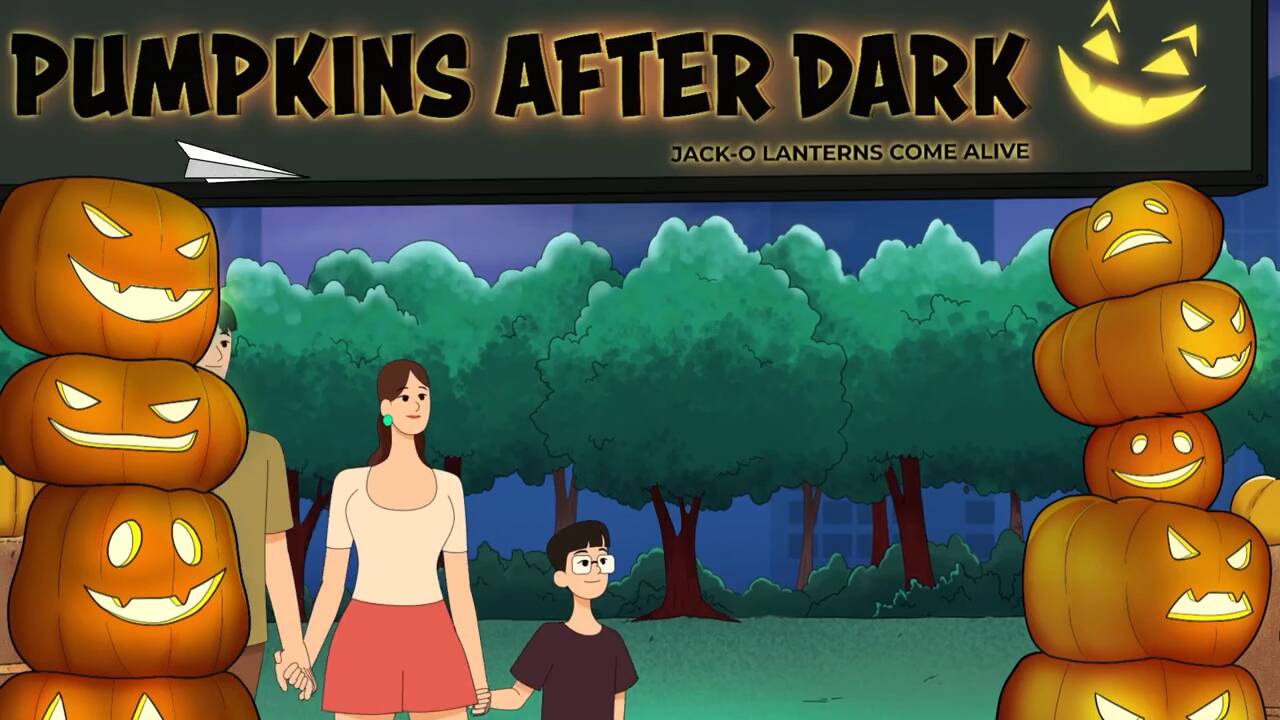
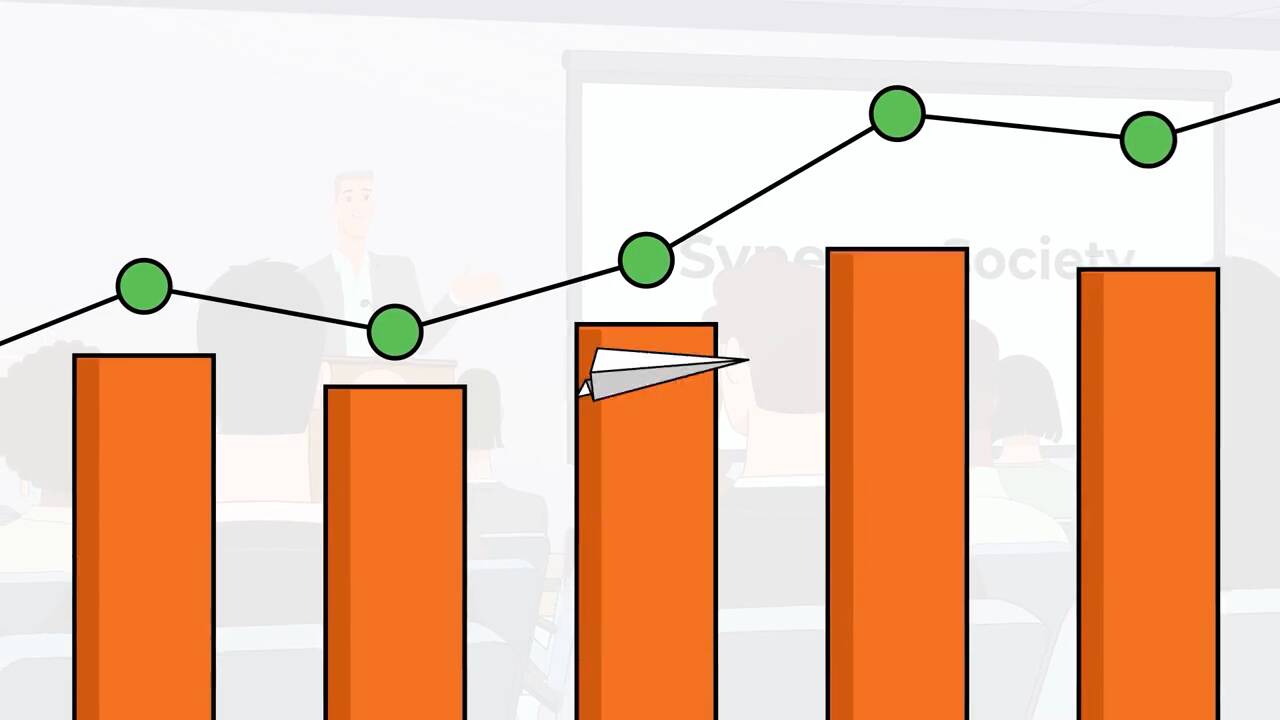
The animation centres on three visitors: a family at the Halloween Festival, a clean energy conference and the Global Ringette Championships. Each one opens up a type of impact. A paper plane carries viewers between scenes across the city, and infographics place the numbers inside each story.
eight scenes from the animation
Across the city
The plane flies from visitor to visitor. Here are eight scenes in order.
1
Landing
Visitors arrive daily by the thousands.
2
Food
Every trip includes a meal.
3
Celebrations
Fireworks light the sky.
4
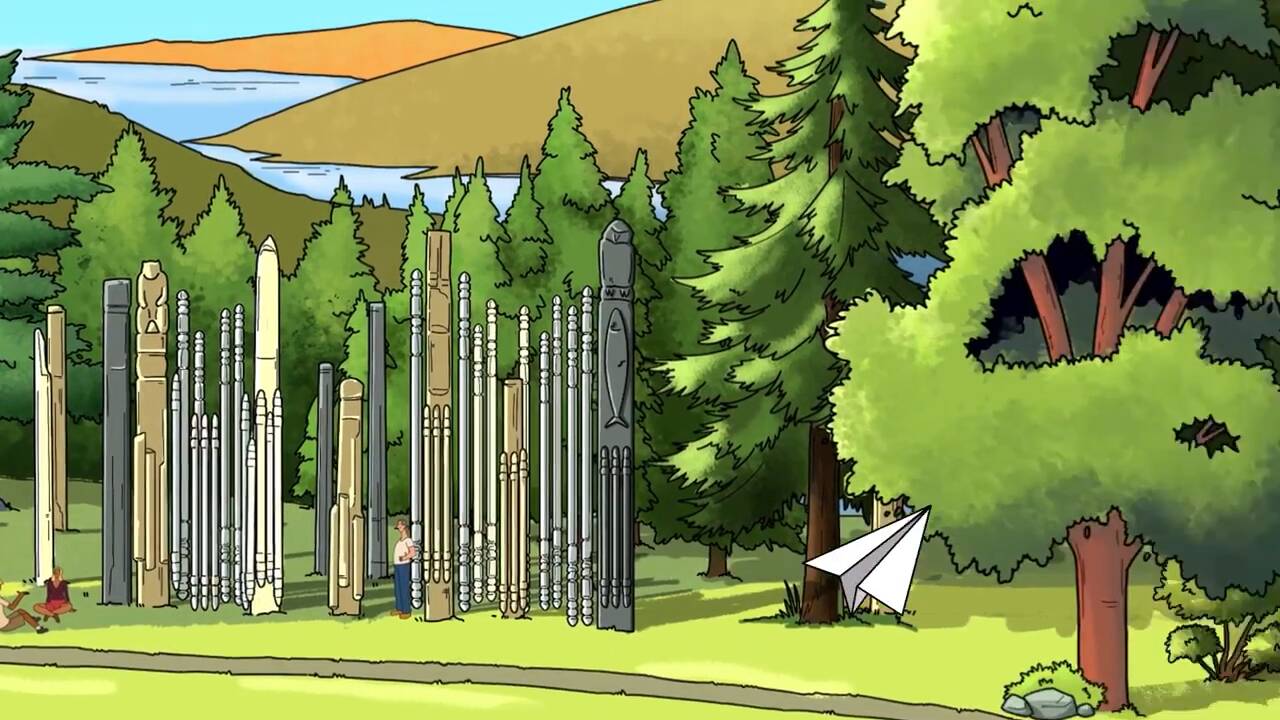
Parks
A Calgary family’s weekend.
5
Direct spend
Visitor dollars as data.
6
Conferences
Events lift local business.
7
Sport
Teams come to compete.
8
It adds up
Every impact combined.
drawn before it moves
Storyboarding the Animation
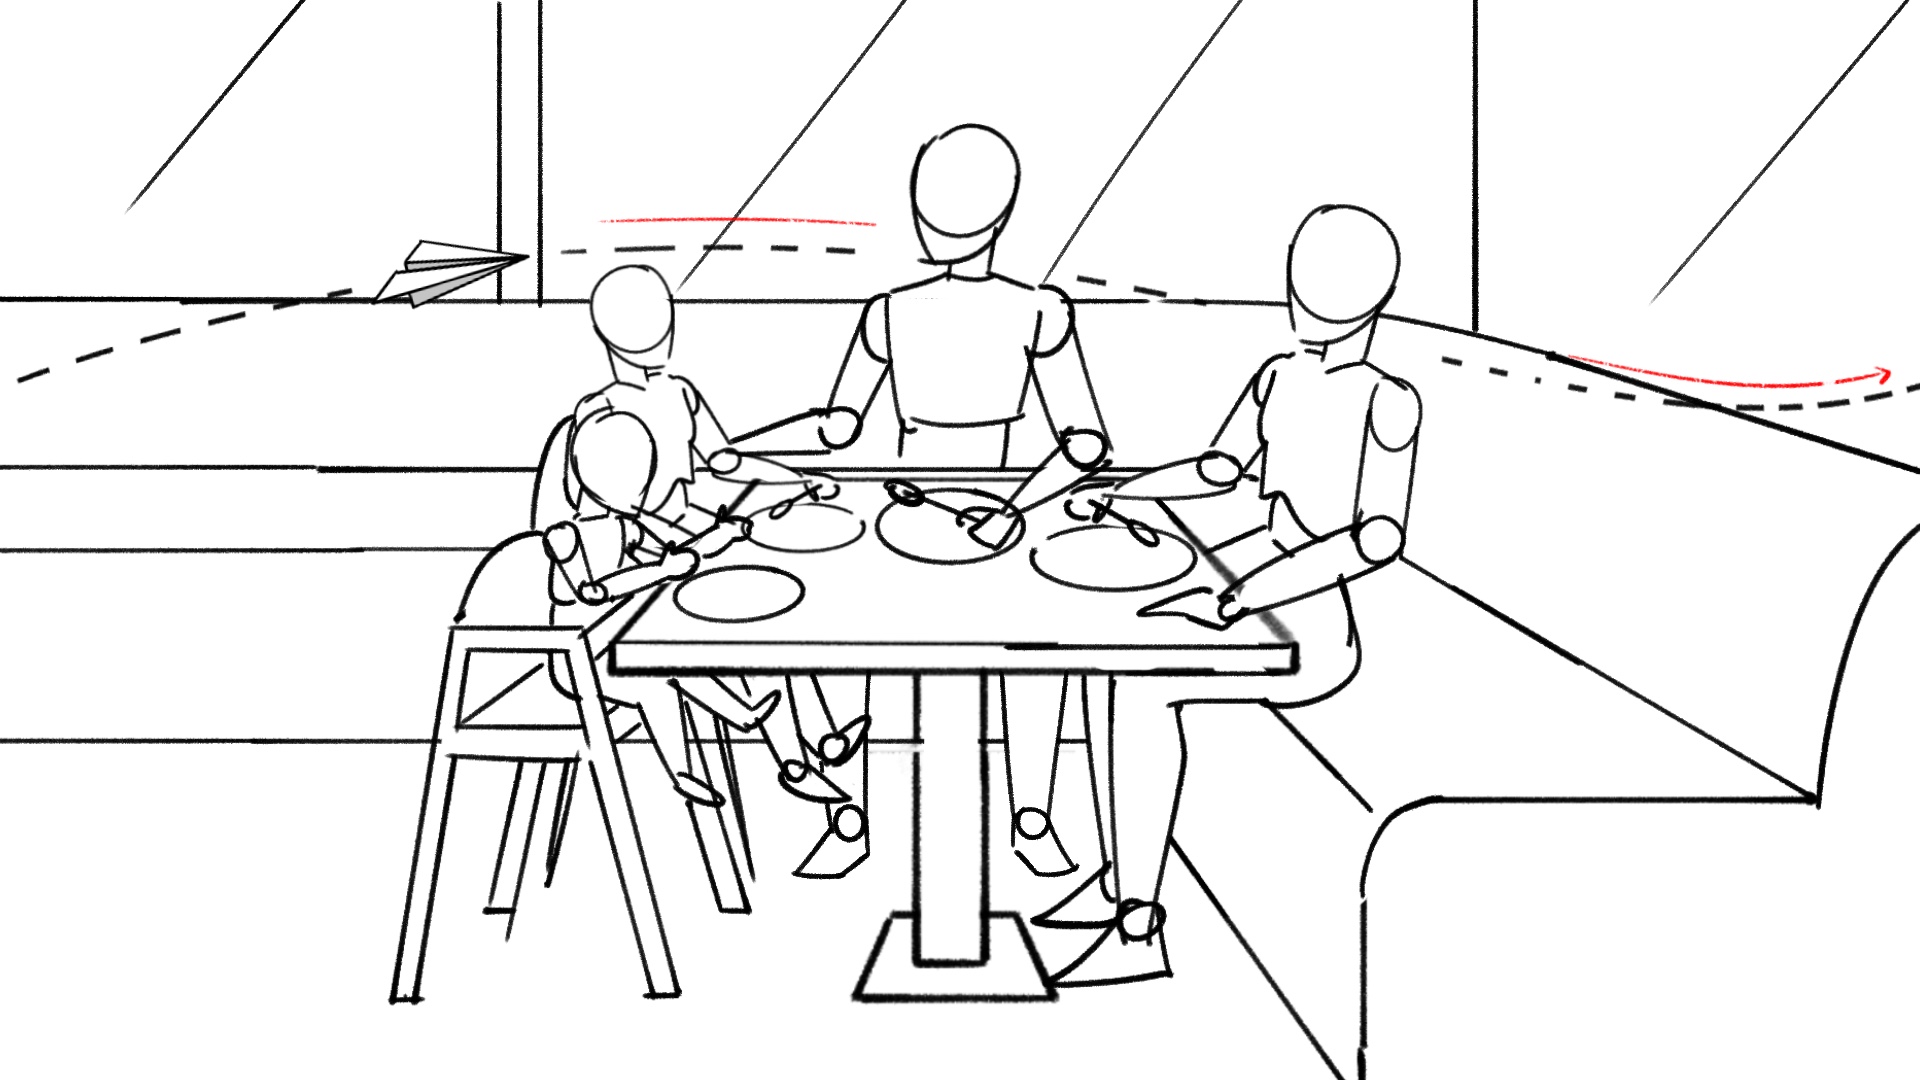
Our artists drew a panel for every narration line before animating, each with one clear action. Select a panel to see the drawing beside the animated frame.
SketchPanel 14Final frame8 of 15
Script
"Meet the Parks from Calgary,"
Action
The family dines inside a restaurant.
the art direction
Illustration and Design
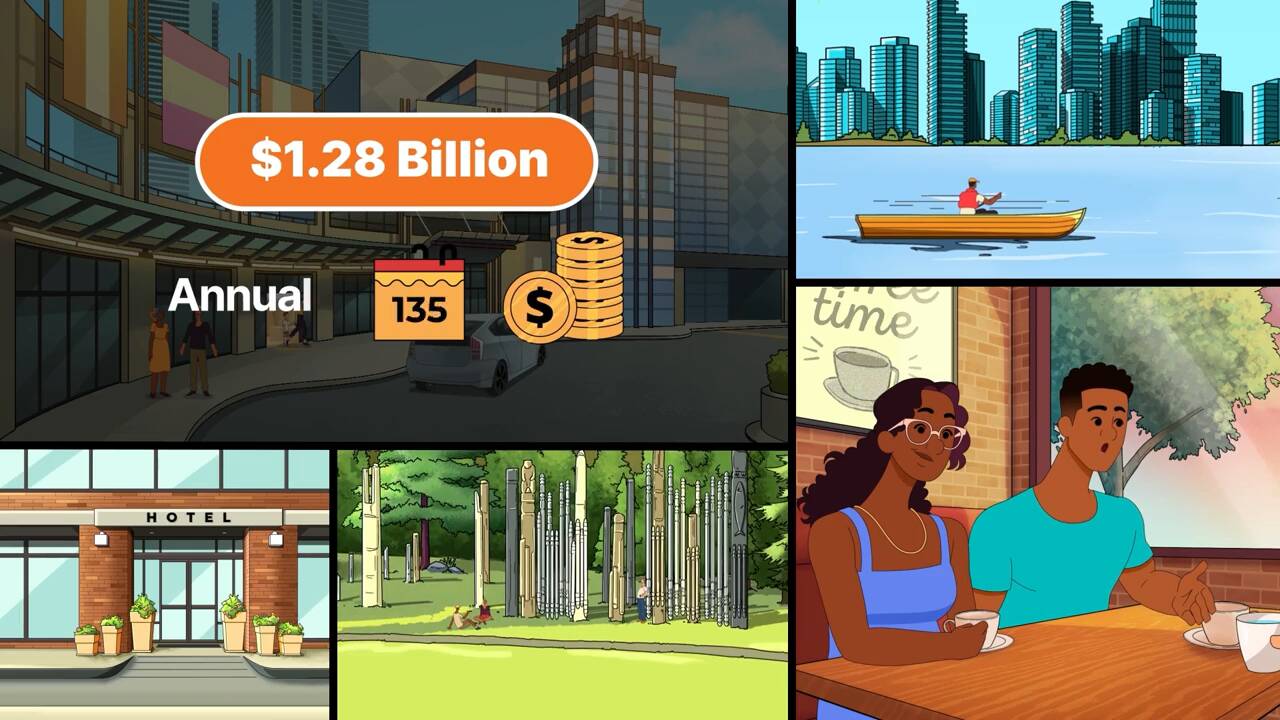
Warm city tones, real Burnaby landmarks and a lively cast of visitors. Charts live inside the scenes, so the numbers never look like slides.